Let’s be honest: a plain Excel range is like a pile of socks on laundry day. Technically useful, but not exactly organized. An Excel table, on the other hand, is what happens when that sock pile gets drawers, labels, and a system that actually makes sense. If you have data in rows and columns and want it to look cleaner, sort faster, filter easier, and behave more like a smart list than a chaotic grid, learning how to make tables in Microsoft Excel is one of the best beginner-friendly skills you can pick up.
In this guide, you’ll learn exactly how to create a table in Excel, format it, manage it, expand it, and use its built-in features without feeling like you need a PhD in spreadsheets. We’ll also cover common mistakes, practical examples, and the little tricks that make Excel tables far more useful than simply coloring a few cells and hoping for the best.
What Is an Excel Table?
In Microsoft Excel, a table is a structured range of data that Excel treats as a connected set. Once you turn a range into a table, Excel adds useful features automatically, such as header-based filtering, sorting tools, special formatting, and smarter formulas. That means your data becomes easier to read, manage, and analyze.
This is not the same thing as just typing data into rows and columns. A real Excel table comes with table functionality. It can automatically expand when you add new rows, keep formatting consistent, and support structured references in formulas. In plain English: your spreadsheet starts acting less like a stubborn brick and more like a helpful assistant.
Why Use a Table Instead of a Normal Range?
Before jumping into the steps, it helps to know why Excel tables are such a big deal. If you are tracking sales, budgets, inventory, leads, employee lists, class rosters, or project tasks, tables make routine spreadsheet work faster and less error-prone.
Main benefits of Excel tables
- Built-in filters and sorting: Each header gets a drop-down arrow, so you can quickly show only the data you need.
- Consistent formatting: Banded rows and table styles make large data sets easier to scan.
- Automatic expansion: Add a new row or column next to the table, and Excel often carries the table formatting and structure forward.
- Total Row tools: You can add quick calculations such as Sum, Average, Count, Max, or Min.
- Structured references: Formulas can use column names instead of cell references like C2:C500.
- Cleaner analysis: Tables work especially well as source data for charts, formulas, and PivotTables.
So yes, making a table in Excel is technically simple. But the reason people love tables is not the creation step. It is everything that becomes easier afterward.
How to Make a Table in Excel: Easy Steps
Step 1: Prepare your data first
Before you create the table, clean up your worksheet. Excel tables work best when your data is arranged in a simple rectangular block. Put your headers in the first row, and make sure each column holds one type of information.
For example, a small sales sheet might look like this:
- Order Date
- Customer Name
- Product
- Quantity
- Unit Price
- Total
Avoid blank rows in the middle of the data. Also avoid mixing different types of information in one column. If one column contains dates, keep it all dates. If one column contains prices, do not suddenly drop a comment like “check later” into the middle of it. Excel is clever, but it still appreciates a little respect.
Step 2: Select your data range
Click any cell inside your data range if the block is already neat and continuous. If your sheet is a little messy or you want full control, drag to select the entire range manually, including headers.
This is important because Excel needs to know what belongs in the table. If you accidentally skip a column or include a random note sitting nearby, the table may not behave the way you expect.
Step 3: Create the table
There are two common ways to do this in Excel:
- Go to Home > Format as Table, then choose a style.
- Or go to Insert > Table.
A dialog box will appear asking Excel to confirm the range. You will also see a checkbox for My table has headers. If your first row contains labels such as Name, Department, Revenue, or Due Date, keep that box checked.
Click OK, and your plain range instantly becomes an Excel table.
Step 4: Pick a table style that is readable
Excel will apply a table design automatically, but you can change it anytime. You do not need to choose the brightest neon option in the gallery just because it exists. In fact, your future self may appreciate a calmer choice.
Good table styling should help you read the data, not distract you from it. Banded rows are great for long tables, while bold header rows make labels easier to spot. A simple, professional style usually works better than one that looks like it was designed by a caffeinated rainbow.
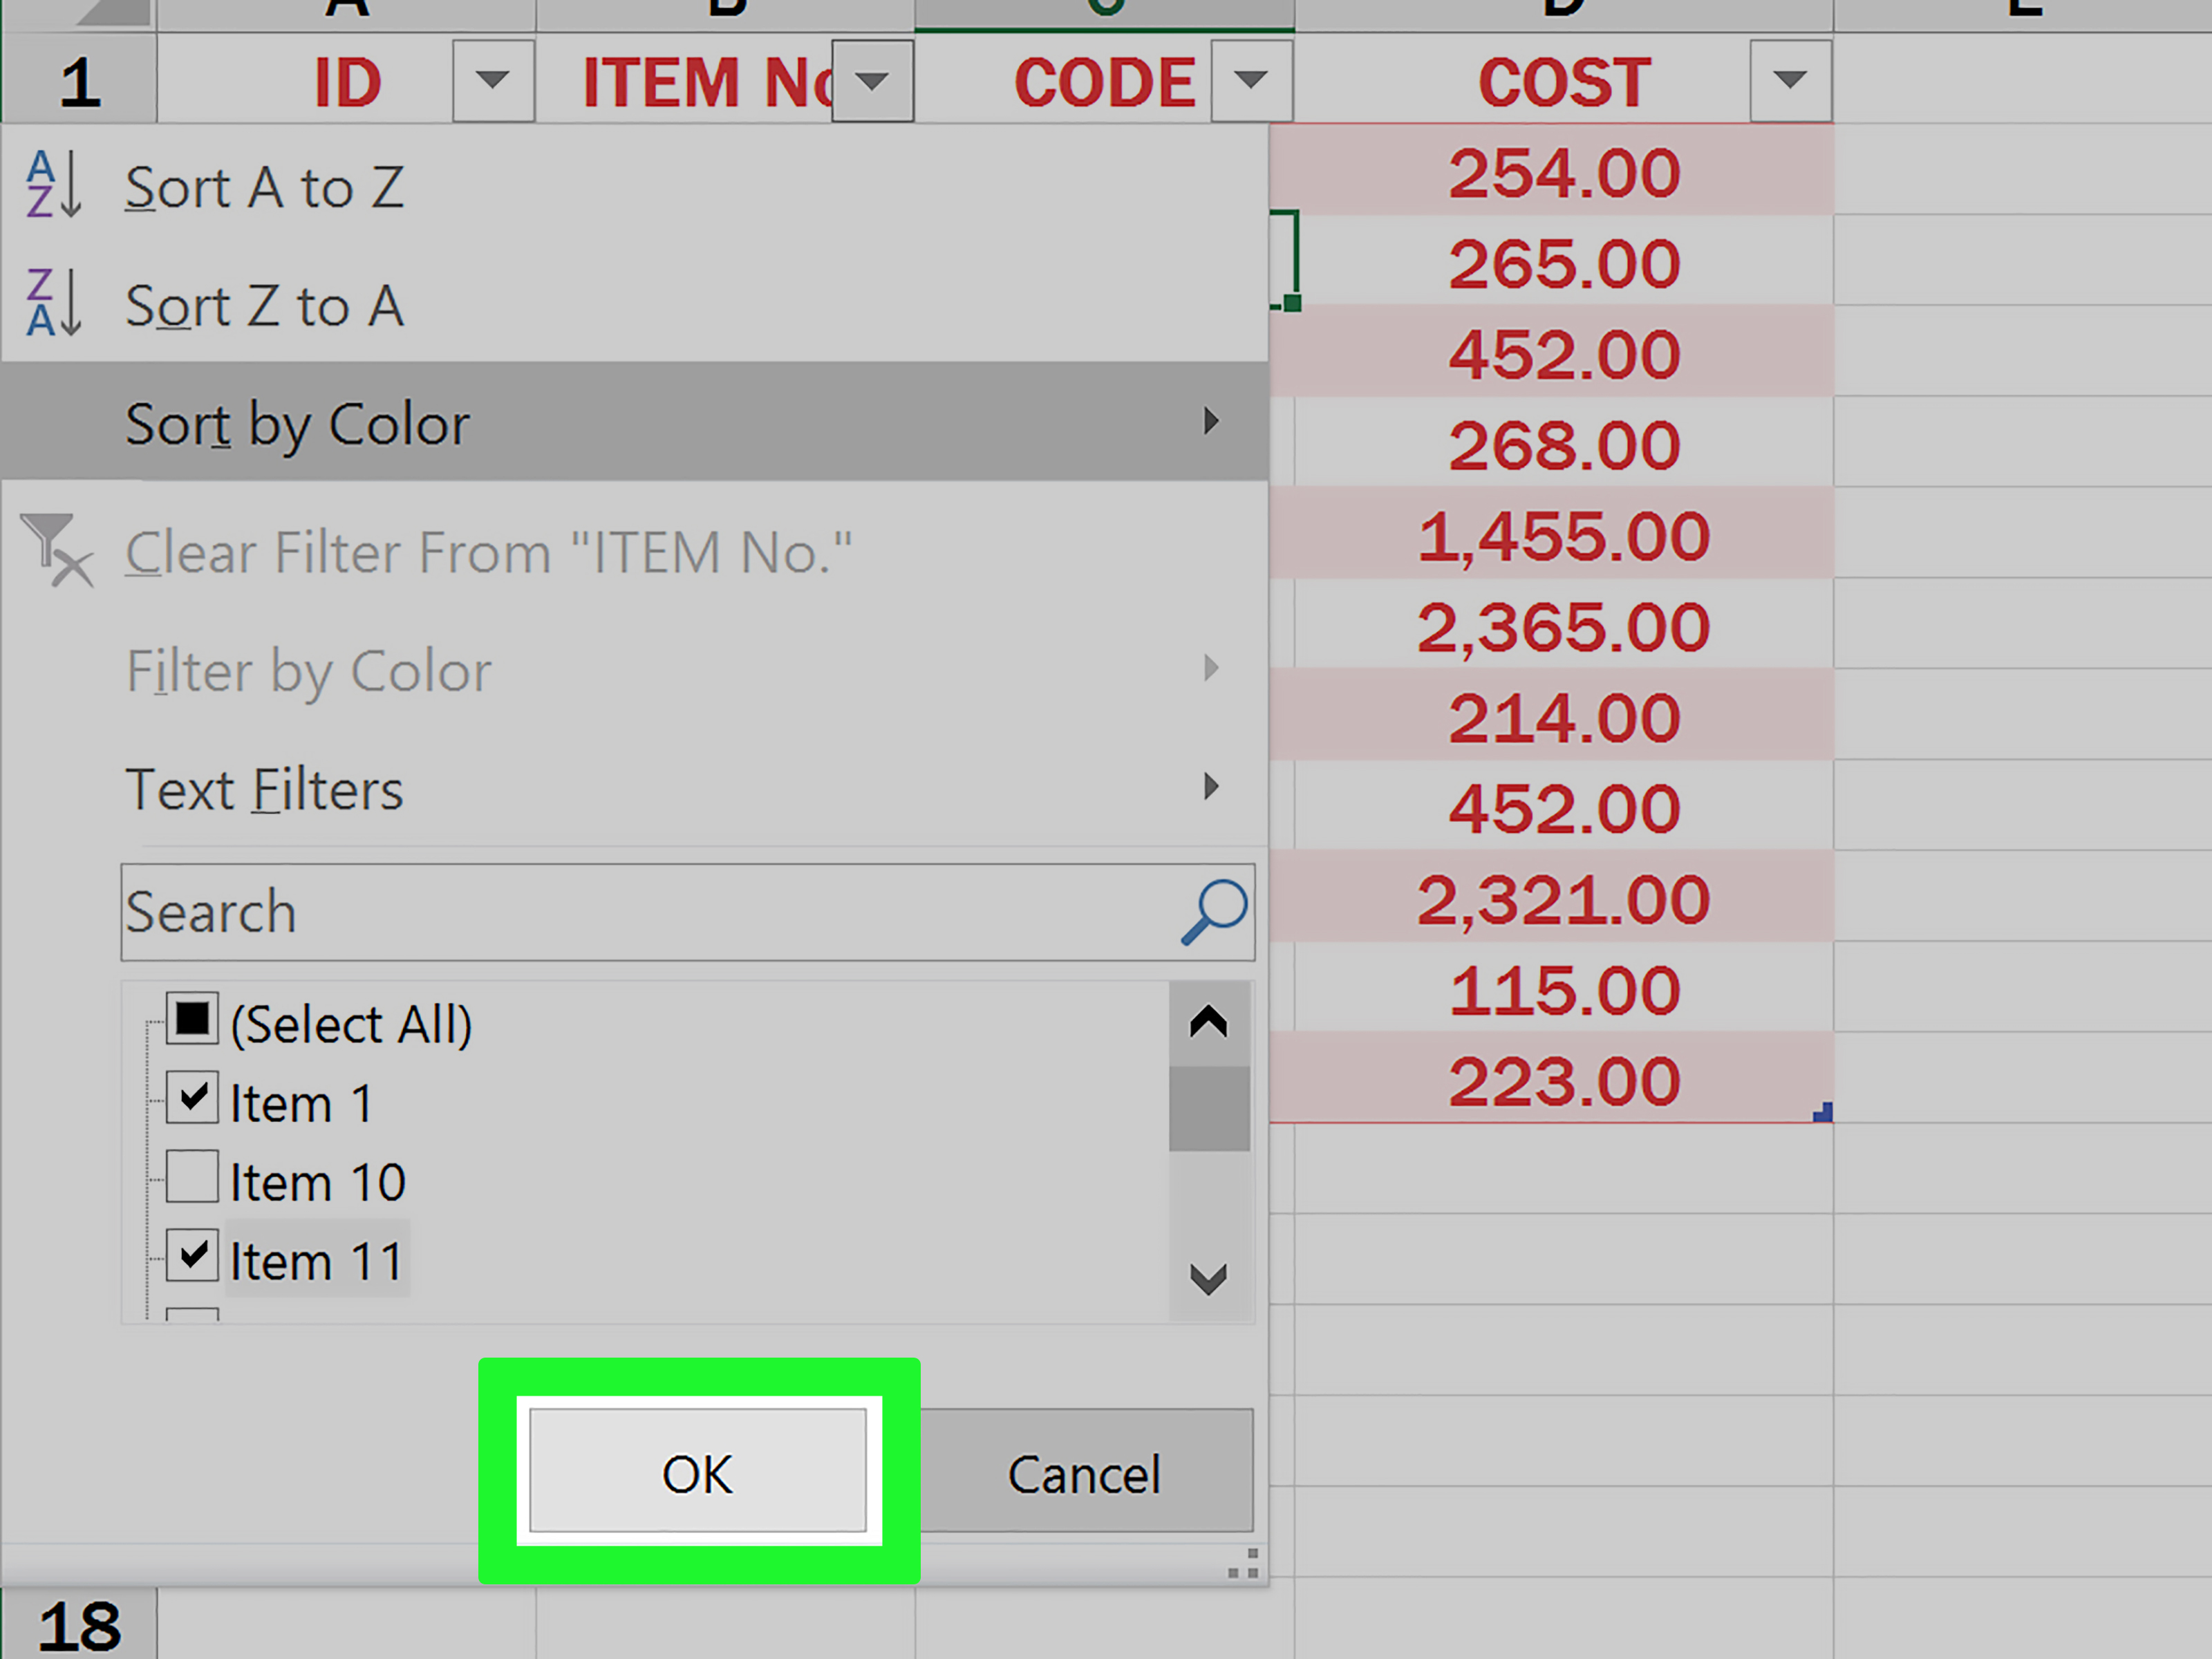
Step 5: Use the filter arrows in the headers
Once the table is created, each column header gets a filter arrow. This is where the table becomes instantly useful.
You can use these arrows to:
- Sort A to Z or Z to A
- Sort smallest to largest or largest to smallest
- Show only specific categories
- Filter by date, number, or text rules
- Find top values quickly
For example, in a product sales table, you can filter to show only one region, one salesperson, or one month. That is much faster than scrolling through 800 rows and whispering, “There has to be a better way,” while your coffee gets cold.
Step 6: Add a Total Row
Want quick calculations at the bottom of the table? Excel has your back. Click anywhere inside the table, then go to the table design options and enable Total Row.
A new row appears at the bottom. Each cell in that row can use a drop-down menu to show calculations such as:
- Sum
- Average
- Count
- Maximum
- Minimum
This is perfect for budgets, invoices, score sheets, or sales trackers. Instead of typing formulas manually for every summary, you can let Excel do the heavy lifting.
Step 7: Rename the table for easier use
By default, Excel assigns a name like Table1 or Table2. That works, but it is not exactly inspiring. If you plan to use formulas, charts, or multiple tables in one workbook, give the table a meaningful name.
Something like SalesData, InventoryList, or EmployeeRoster is much easier to understand than Table7, which sounds like something reserved at a chaotic wedding reception.
A clear table name also helps when working with structured references and formulas later.
How to Work with Table Formulas in Excel
One of the smartest parts of Excel tables is how formulas behave inside them. When you type a formula in one cell of a table column, Excel often fills the rest of that column automatically. This creates what is called a calculated column.
Let’s say your table has a Quantity column and a Unit Price column. In the Total column, you can enter a formula based on those fields. Excel then copies it down the table automatically.
Tables also support structured references, which means formulas can refer to column names instead of traditional cell ranges. That makes formulas more readable and often less fragile when your table grows.
Instead of relying on a formula style that looks like a secret code, you can work with references tied to meaningful headers. For many users, this is the moment when Excel stops feeling like punishment and starts feeling useful.
How to Add More Rows and Columns to a Table
Excel tables are built to grow. If you type directly below the last row of a table, Excel will usually extend the table automatically. The same often happens when you type in a new column immediately to the right.
You can also resize the table manually if needed. Click anywhere in the table and use the sizing handle at the lower-right corner to drag it bigger or smaller.
This makes tables ideal for ongoing data such as weekly expenses, monthly sales, customer records, or project updates. You do not have to rebuild the formatting each time new data arrives.
How to Convert a Table Back to a Normal Range
Sometimes you want the look of the table but not the table functionality. No problem. Excel lets you convert a table back to a regular range.
Click anywhere inside the table, go to the table tools area, and choose Convert to Range. The formatting can stay, but table-specific features such as structured references and built-in filter behavior are removed.
This is helpful when you need a more traditional sheet layout, or when a table is getting in the way of a particular type of custom formatting or workflow.
Common Mistakes to Avoid When Making Tables in Excel
Using blank rows inside the data
Blank rows can break the flow of your data and confuse filters, formulas, or sorting. Keep the data continuous whenever possible.
Forgetting headers
Headers are not optional decoration. They tell Excel what each column represents. Without clear headers, your table becomes harder to filter, summarize, and understand.
Mixing data types in one column
A column should not contain dates, random words, percentages, and a motivational quote all at once. Keep each column focused on one type of information.
Choosing style over readability
Fancy formatting can be fun, but clarity matters more. A table should look professional and be easy to scan.
Confusing an Excel table with a PivotTable
A standard Excel table helps organize and manage source data. A PivotTable is a separate analysis tool used to summarize that data. Think of the table as the pantry and the PivotTable as the meal you prepare from it.
Real Example: Turning a Small Sales List into a Smart Excel Table
Imagine you have a worksheet with six columns: Date, Customer, Product, Quantity, Unit Price, and Total. You enter 50 rows of sales data.
First, select the range and create the table. Next, confirm the header row. Then pick a readable style with alternating row colors. After that, enable the Total Row so you can instantly see the sum of all sales. Add a formula in the Total column to multiply Quantity by Unit Price, and Excel fills it down automatically.
Now filter by Product to see sales for one item only. Sort by Total from largest to smallest to find top orders. Add a few new rows next week, and the table expands as your data grows.
Same information. Far less chaos. Much better spreadsheet karma.
Best Practices for Clean, Professional Excel Tables
- Use short, descriptive column names.
- Keep one row for headers and one row per record.
- Do not merge cells inside the table.
- Use consistent number formats, especially for currency, dates, and percentages.
- Choose a style that prints well and reads well.
- Name important tables clearly.
- Use the table as the source for charts and PivotTables when possible.
Conclusion
Learning how to make tables using Microsoft Excel is one of the easiest upgrades you can make to your spreadsheet skills. The process is simple: prepare your data, select the range, create the table, confirm headers, and start using the built-in tools. But the value goes far beyond those clicks.
Excel tables help you sort faster, filter smarter, format consistently, and build formulas that are easier to manage. They also make your worksheets look more polished and feel more professional. Whether you are organizing a budget, managing a contact list, tracking tasks, or building a report, tables can turn a cluttered sheet into something that actually works for you.
In other words, if your spreadsheet currently looks like a digital junk drawer, creating an Excel table is a very good place to start cleaning it up.
Practical Experiences and Lessons from Using Excel Tables
One of the most common experiences people have when they first start using Excel tables is surprise. Not because the steps are difficult, but because the improvement feels immediate. A messy worksheet that once required endless scrolling and manual formatting suddenly becomes easier to read and much faster to manage. Users often realize they had been doing repetitive work for months, sometimes years, without knowing Excel already had a built-in structure designed for exactly that problem.
A typical beginner experience starts with something simple, like a household budget or a small business sales list. At first, the sheet is just data in cells. Then the user converts it into a table, sees filter arrows appear in the headers, and suddenly understands why tables matter. Instead of hunting line by line for a category like “Groceries” or “March orders,” they can filter the table in seconds. That moment usually changes how they think about spreadsheets.
Another practical lesson shows up when data grows over time. Many people manually copy formulas down new rows every week, especially in trackers for inventory, attendance, invoices, or project tasks. Once they begin using Excel tables, they notice that formulas in calculated columns fill down automatically far more smoothly. This saves time, but more importantly, it reduces mistakes. A forgotten formula in row 128 can quietly ruin a report. Tables help prevent those small errors from turning into bigger headaches.
There is also a formatting lesson that comes from experience. New users often overdesign their spreadsheets with bright colors, merged cells, odd spacing, and decorative extras that look exciting for five minutes and exhausting forever after that. Excel tables teach a better habit: structure first, style second. A clean header row, consistent number formatting, and readable banded rows usually outperform flashy design choices.
People who work with reports also discover that tables are excellent starting points for deeper analysis. Once data is organized as a table, it becomes easier to build charts, summaries, and PivotTables. This means the table is not just the end product; it becomes the foundation for smarter reporting. That is especially useful in workplaces where data changes often and reports must be updated regularly.
Perhaps the biggest real-world takeaway is confidence. Users who once felt intimidated by Excel often feel more in control after learning tables. The feature is approachable, practical, and useful across personal, academic, and professional tasks. In many cases, mastering this one skill creates momentum. After tables, people usually become more comfortable exploring formulas, filters, sorting, charts, and data analysis. So while making tables in Excel may sound like a small skill, the experience of using them often becomes the first step toward using spreadsheets much more effectively.