Customer lifetime value sounds like one of those serious boardroom phrases that requires a calculator, a finance degree, and a very patient spreadsheet named “FINAL_final_v12.xlsx.” Good news: it does not have to be painful. At its core, customer lifetime value, or CLV, answers a simple question: how much is a customer worth to your business over time?
That question matters because not all customers behave the same way. One customer buys once, uses a coupon, disappears, and lives happily ever after somewhere else. Another customer buys every month, refers three friends, upgrades twice, leaves glowing reviews, and basically deserves a tiny statue in your office. CLV helps you tell the difference before you spend your marketing budget like confetti at a parade.
This guide shows you how to model customer lifetime value quickly and practically. No unnecessary math fog. No “enterprise transformation journey” vocabulary soup. Just the formulas, data, examples, and decision-making steps you can actually use.
What Is Customer Lifetime Value?
Customer lifetime value is the total revenue or profit a business expects to earn from a customer during the full relationship with that customer. It can be calculated historically, using what customers already spent, or predicted, using retention, churn, purchase frequency, margin, and future behavior.
In plain English, CLV is your estimate of how valuable a customer relationship is. The “relationship” may last one week, three years, or a decade, depending on your business model. An ecommerce brand may define lifetime value by repeat purchases. A SaaS company may model it through monthly recurring revenue and churn. A service business may use contract renewals, upsells, referrals, and support costs.
CLV vs. LTV: Are They the Same?
You will often see CLV, CLTV, and LTV used almost interchangeably. Some teams use CLV for customer-level analysis and LTV for average lifetime value across a segment. Others use LTV because it is shorter and looks cleaner on a dashboard. The practical takeaway is simple: define the metric clearly inside your company so finance, marketing, sales, and product are not arguing over three acronyms that are wearing the same hat.
Why Modeling Customer Lifetime Value Matters
A fast customer lifetime value model helps you make better business decisions in five major areas: acquisition, retention, pricing, segmentation, and forecasting.
1. Smarter Customer Acquisition
If your average customer is worth $600 in gross profit over two years, spending $450 to acquire that customer may be risky. If a specific customer segment is worth $2,000, a higher acquisition cost may be completely reasonable. CLV gives customer acquisition cost, or CAC, context. Without CLV, CAC is just a lonely number sitting in a spreadsheet wondering what it did wrong.
2. Better Retention Decisions
Retention is one of the biggest drivers of lifetime value. Even small improvements in repeat purchase rate, renewal rate, or churn can produce meaningful gains. A CLV model helps you identify where retention efforts are most valuable. Instead of giving every customer the same discount, you can focus incentives, onboarding, support, and loyalty campaigns where they are likely to pay off.
3. Clearer Customer Segmentation
Average CLV is useful, but segmented CLV is where the good stuff lives. Customers acquired through organic search may stay longer than customers from paid social. Enterprise accounts may have higher revenue but longer payback periods. First-time buyers of one product may become repeat customers faster than buyers of another. Segmentation turns CLV from a single number into a growth map.
4. Practical Budgeting and Forecasting
CLV connects marketing activity with future cash flow. When you know your expected lifetime value by cohort, you can forecast future revenue more realistically. This helps teams set acquisition budgets, evaluate campaigns, plan inventory, prioritize customer success resources, and decide whether growth is efficient or just expensive.
The Fastest CLV Formula You Can Use Today
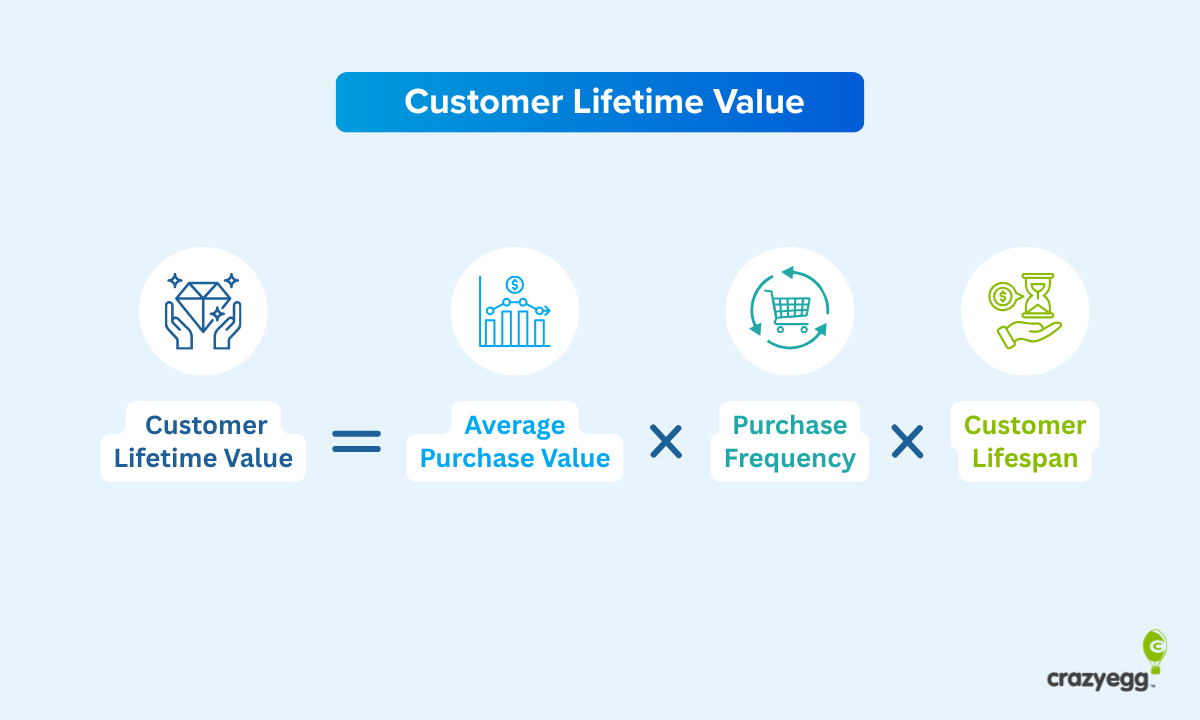
The quickest customer lifetime value formula is:
Customer Lifetime Value = Average Order Value × Purchase Frequency × Average Customer Lifespan
Let’s break that down:
- Average Order Value (AOV): Total revenue divided by number of orders.
- Purchase Frequency: Number of purchases divided by number of customers during a period.
- Average Customer Lifespan: How long a customer typically continues buying from you.
Simple Example
Imagine an online coffee brand with these numbers:
- Average order value: $40
- Average purchase frequency: 6 orders per year
- Average customer lifespan: 3 years
The basic CLV model is:
$40 × 6 × 3 = $720
That means the average customer is expected to generate $720 in revenue over the relationship. Helpful? Yes. Complete? Not quite. Revenue is not profit, and your landlord will not accept “revenue vibes” as rent.
Use Gross Margin to Make CLV More Useful
Revenue-based CLV is fine for a quick starting point, but profit-based CLV is better for decision-making. To get closer to reality, multiply by gross margin.
Gross Margin CLV = Revenue CLV × Gross Margin
If the coffee brand has a 55% gross margin, the calculation becomes:
$720 × 55% = $396
Now the customer is worth about $396 in gross profit before marketing, overhead, support, and other operating expenses. This is the number you should compare more carefully against acquisition cost and retention investment.
Subscription CLV Formula for SaaS and Membership Businesses
For subscription companies, customer lifetime value is often modeled using average revenue, gross margin, and churn rate.
Subscription CLV = Average Revenue per Account × Gross Margin ÷ Churn Rate
Example:
- Average monthly revenue per customer: $100
- Gross margin: 80%
- Monthly churn rate: 5%
The model becomes:
($100 × 80%) ÷ 5% = $1,600
This suggests the average customer contributes about $1,600 in gross margin over the expected subscription lifetime. The formula is fast, but it assumes churn is stable. If churn varies heavily by customer age, acquisition source, product usage, or contract type, use cohort analysis for a more accurate view.
A Practical Step-by-Step CLV Modeling Process
You do not need to build the world’s most beautiful predictive model on day one. In fact, please do not. Start simple, validate your assumptions, then add complexity only when it improves decisions.
Step 1: Choose the Business Question
Before touching the data, decide what you want the model to answer. Common CLV questions include:
- How much can we afford to spend to acquire a customer?
- Which marketing channels bring the highest-value customers?
- Which customer segments deserve premium support or retention campaigns?
- How much future revenue should we expect from a new cohort?
- Which product or plan attracts customers with the best long-term value?
A model built for acquisition budgeting may look different from a model built for customer success prioritization. The best CLV model is not the most complicated one. It is the one that answers the question without turning your team into spreadsheet archaeologists.
Step 2: Pick a Time Horizon
Do you want 12-month CLV, 24-month CLV, 36-month CLV, or full lifetime CLV? For practical business decisions, a fixed time horizon is often more useful than “forever.” Forever sounds impressive, but in modeling, forever can be where assumptions go to misbehave.
For fast planning, many teams start with:
- 90-day CLV for early ecommerce repeat purchase behavior
- 12-month CLV for marketing budget and channel comparison
- 24- or 36-month CLV for SaaS, subscriptions, and retention planning
Step 3: Gather the Minimum Useful Data
To model CLV quickly, collect the following fields:
- Customer ID
- Order or invoice date
- Revenue per transaction
- Gross margin or cost of goods sold
- Acquisition source or campaign
- Customer signup date or first purchase date
- Cancellation date, churn date, or last active date
- Returns, refunds, discounts, and support costs if available
If you do not have perfect data, start with what you have. A rough but honest model beats a perfect model that never leaves the conference room.
Step 4: Clean the Data
Data cleaning is where CLV modeling becomes less glamorous but more accurate. Remove test orders, duplicate customers, canceled transactions, internal accounts, fraud, extreme one-time outliers, and records with missing customer IDs. Decide how to treat refunds, taxes, shipping revenue, discounts, and gift cards.
For ecommerce, use net revenue after returns when possible. For SaaS, separate expansion revenue from base subscription revenue. For marketplaces, focus on contribution margin instead of gross transaction value when fees and payouts matter.
Step 5: Segment Before You Average
One average CLV number can hide important differences. A blended average may tell you the average customer is worth $500, but one segment may be worth $1,200 while another is worth $110. That difference changes everything.
Useful segments include:
- Acquisition channel
- First product purchased
- Geographic market
- Customer type, such as SMB, mid-market, or enterprise
- Plan tier
- Discounted vs. full-price customers
- Monthly vs. annual subscribers
Segmentation helps you avoid the classic mistake of overfunding channels that bring cheap customers who do not stay.
Three Practical CLV Models to Choose From
Model 1: The Basic Spreadsheet Model
This is the best starting point for small businesses, early-stage startups, and teams that need answers this week. Use average order value, purchase frequency, lifespan, and gross margin. It is simple, fast, and easy to explain.
Best for: early planning, small datasets, quick marketing decisions, simple ecommerce stores.
Weakness: it can oversimplify retention, churn, and customer behavior.
Model 2: Cohort-Based CLV
Cohort analysis groups customers by a shared starting point, such as the month they first purchased or subscribed. Then you track how much each cohort spends over time.
For example, customers acquired in January may generate:
- Month 1: $80 per customer
- Month 2: $32 per customer
- Month 3: $18 per customer
- Month 6: $12 per customer
- Month 12: $8 per customer
By stacking these periods, you can estimate 12-month or 24-month CLV. Cohort-based CLV is especially useful because it shows how value accumulates over time and whether newer customers are better or worse than older customers.
Best for: ecommerce, SaaS, mobile apps, subscriptions, and businesses with repeat behavior.
Weakness: newer cohorts have incomplete data, so you must forecast later months carefully.
Model 3: Predictive CLV
Predictive CLV uses customer behavior signals to forecast future value. Common inputs include recency, frequency, monetary value, product usage, engagement, customer support history, discount behavior, plan tier, and churn risk.
Some predictive models use RFM analysis, where customers are scored by how recently they purchased, how frequently they purchase, and how much they spend. More advanced models may use probability-based methods, regression, survival analysis, or machine learning to estimate future transactions and churn.
Best for: larger datasets, personalized marketing, churn prevention, lifecycle automation, and customer scoring.
Weakness: requires cleaner data, validation, and ongoing monitoring.
How to Build a Fast CLV Model in a Spreadsheet
Here is a practical structure you can build in Excel, Google Sheets, or your BI tool.
Inputs
- Average order value
- Orders per customer per year
- Average customer lifespan
- Gross margin
- Customer acquisition cost
- Retention rate or churn rate
- Discount rate, if modeling future cash flows
Core Calculations
- Revenue CLV: AOV × Purchase Frequency × Lifespan
- Gross Profit CLV: Revenue CLV × Gross Margin
- Net CLV: Gross Profit CLV − Acquisition Cost − Service Costs
- LTV:CAC Ratio: Gross Profit CLV ÷ CAC
- Payback Period: CAC ÷ Average Monthly Gross Profit per Customer
For most teams, gross profit CLV and CAC payback period are more useful than revenue CLV alone. A customer who generates $1,000 in revenue but costs $950 to acquire and serve is not a hero customer. That customer is wearing a cape made of expenses.
How to Add Discounting Without Making It Weird
If your model forecasts value over multiple years, future cash is not worth the same as cash today. That is why finance teams use a discount rate to estimate the present value of future cash flows.
A practical discounted CLV model looks like this:
Discounted CLV = Sum of expected future margin per period ÷ (1 + discount rate)period
For fast modeling, you do not need to overcomplicate it. Use discounting when:
- Your customer relationships last several years
- Your sales cycle is long
- You compare customer value to investment returns
- You are making board-level or investor-facing forecasts
For short ecommerce cycles, a basic 12-month or 24-month gross margin CLV may be enough.
Common CLV Modeling Mistakes
Mistake 1: Using Revenue Instead of Profit
Revenue CLV can make customers look more attractive than they are. Always try to include gross margin, returns, discounts, payment processing fees, shipping subsidies, and service costs where possible.
Mistake 2: Treating All Customers the Same
Average CLV is a starting point, not the finish line. Segment by channel, product, plan, geography, and customer type. You may discover that your “expensive” channel is actually profitable because it brings loyal buyers, while your “cheap” channel brings bargain hunters who vanish faster than snacks in a meeting room.
Mistake 3: Ignoring Churn Timing
A monthly churn rate is not always constant. Many subscription businesses experience high early churn after trial or onboarding, then lower churn among customers who survive the first few months. Cohort retention curves reveal these patterns much better than a single average churn number.
Mistake 4: Confusing Correlation With Strategy
High-value customers may share certain behaviors, but that does not always mean those behaviors cause high value. For example, customers who use five features may have higher retention, but forcing every new user into five features may not work. Use CLV insights to form hypotheses, then test campaigns and product changes.
Mistake 5: Forgetting Model Maintenance
Customer behavior changes. Prices change. Channels change. Competitors change. Your CLV model should be refreshed regularly. Monthly is useful for fast-moving ecommerce or SaaS. Quarterly may be enough for slower B2B cycles.
How to Use CLV in Real Business Decisions
Marketing Budget Allocation
Compare CLV by acquisition channel. If paid search customers have a 12-month gross CLV of $420 and paid social customers have a 12-month gross CLV of $180, your budget conversation changes. You may still invest in paid social, but you will set different CAC targets, creative strategies, and retention follow-ups.
Retention Campaigns
Use CLV to prioritize win-back campaigns, loyalty offers, and customer success outreach. A high-value customer who has not purchased in 60 days deserves a different message than a low-margin customer who only buys during extreme discounts.
Pricing and Packaging
CLV can reveal whether certain plans, bundles, or product categories produce better long-term customers. If customers who start with a starter plan upgrade frequently and retain well, that plan may be a great acquisition doorway. If customers who enter through heavy discounts churn quickly, the “deal” may be more expensive than it looks.
Sales Prioritization
For B2B companies, predicted CLV can help sales teams prioritize leads and accounts. A smaller deal with strong expansion potential may be more valuable than a large one-time contract with poor renewal odds.
A Practical CLV Example: Ecommerce Store
Suppose a skincare ecommerce brand wants to decide how much it can spend on new customers. It calculates the following:
- Average first order value: $65
- Average yearly repeat purchases: 3
- Average customer lifespan: 2 years
- Gross margin: 60%
- Average support, returns, and shipping subsidy per customer: $28
Revenue CLV:
$65 × 3 × 2 = $390
Gross profit CLV:
$390 × 60% = $234
Contribution CLV after service costs:
$234 − $28 = $206
If the brand wants a 3:1 CLV-to-CAC ratio, it should aim for a CAC around $69 or lower. That does not mean every campaign above $69 is bad, but it does create a practical benchmark for testing.
A Practical CLV Example: SaaS Company
Now imagine a SaaS company with:
- Average monthly revenue per account: $250
- Gross margin: 85%
- Monthly churn: 4%
- Average CAC: $1,500
Subscription CLV:
($250 × 85%) ÷ 4% = $5,312.50
LTV:CAC ratio:
$5,312.50 ÷ $1,500 = 3.54
This looks healthy on the surface. But the company should still inspect cohorts. If churn is 12% in month one and much lower afterward, onboarding may be the best lever. If annual subscribers retain far better than monthly subscribers, pricing incentives may improve lifetime value.
Experience-Based Insights: What Practical CLV Modeling Teaches You
In real business work, customer lifetime value modeling is rarely a perfectly polished exercise. It is more like cleaning out a garage: you find useful things, confusing things, and at least one mystery box labeled “misc revenue.” The most important lesson is that CLV becomes powerful when it changes decisions, not when it looks impressive in a dashboard.
One practical experience many teams share is that the first CLV model exposes data problems immediately. Customer IDs may not match across ecommerce, CRM, email, and payment systems. Refunds may be recorded separately from purchases. Some customers may use multiple emails. Offline sales may never make it into the digital analytics platform. This can feel frustrating, but it is actually valuable. CLV modeling often becomes the reason a company finally improves its data hygiene.
Another real-world lesson is that customer lifetime value often challenges marketing assumptions. A channel with a low cost per acquisition may not produce the best customers. For example, a discount-heavy campaign can bring in many first-time buyers, but those buyers may have low repeat rates and weak margins. Meanwhile, organic search, referrals, or educational content may produce fewer customers at first, but those customers may trust the brand more, buy again, and require fewer incentives. CLV helps teams stop celebrating cheap acquisition when it creates expensive churn.
In ecommerce, practical CLV modeling often reveals the importance of the first product purchased. A hero product may generate volume but not loyalty, while a less flashy product may introduce customers to a repeat-buying routine. For example, a customer who buys a one-time gift item may never return, while a customer who buys a consumable product may come back every six weeks. When you model CLV by first product, merchandising and advertising strategy become much smarter.
In SaaS, experience shows that onboarding quality can matter as much as acquisition quality. A customer who activates quickly, invites teammates, uses core features, and receives help early may become far more valuable than a customer who signs up and drifts away silently. CLV modeling becomes even stronger when paired with product usage data. Instead of asking only “How much did this customer pay?” you start asking “What behaviors predict that this customer will stay?”
For service businesses, CLV modeling teaches another lesson: high revenue does not always mean high value. Some clients pay well but demand excessive support, customization, revisions, or account management time. Others may pay slightly less but renew consistently, refer new business, and collaborate smoothly. A practical CLV model should include service cost or at least a customer effort score. Otherwise, your “best customer” list may accidentally include the clients responsible for everyone’s stress snacks.
The most useful CLV models also create better conversations between teams. Marketing learns which customers are worth acquiring. Sales learns which accounts have long-term potential. Product learns which behaviors connect to retention. Customer success learns where proactive outreach matters. Finance gets a clearer view of payback and growth efficiency. When CLV becomes a shared operating metric, teams stop optimizing isolated numbers and start improving the full customer journey.
Finally, practical CLV modeling teaches humility. Models are estimates, not crystal balls. They should be tested, refreshed, and challenged. If your model predicts high value from a segment, run campaigns and measure whether the prediction holds. If your retention assumptions change, update the model. If pricing changes, rebuild the forecast. The goal is not to be perfectly right forever. The goal is to be directionally useful now and increasingly accurate over time.
Conclusion: Build the Model, Then Use It
Modeling customer lifetime value does not need to be slow, intimidating, or buried under unnecessary complexity. Start with a basic formula, add gross margin, segment your customers, compare CLV to CAC, and use cohort analysis when retention patterns matter. As your data improves, you can move toward predictive models using RFM, churn risk, product usage, and customer behavior signals.
The practical magic of CLV is not the formula itself. The magic is what it helps you decide: where to spend, whom to retain, which customers to prioritize, which products create loyalty, and whether your growth is truly profitable. A fast CLV model will not answer every question, but it will give your business a sharper compass. And in a world where marketing budgets can disappear with one enthusiastic ad campaign, a compass is much better than a shrug.
Note: This article is written for publication as general business and marketing guidance. Businesses should adapt the formulas and assumptions to their own data, margins, customer behavior, accounting standards, and decision-making needs.