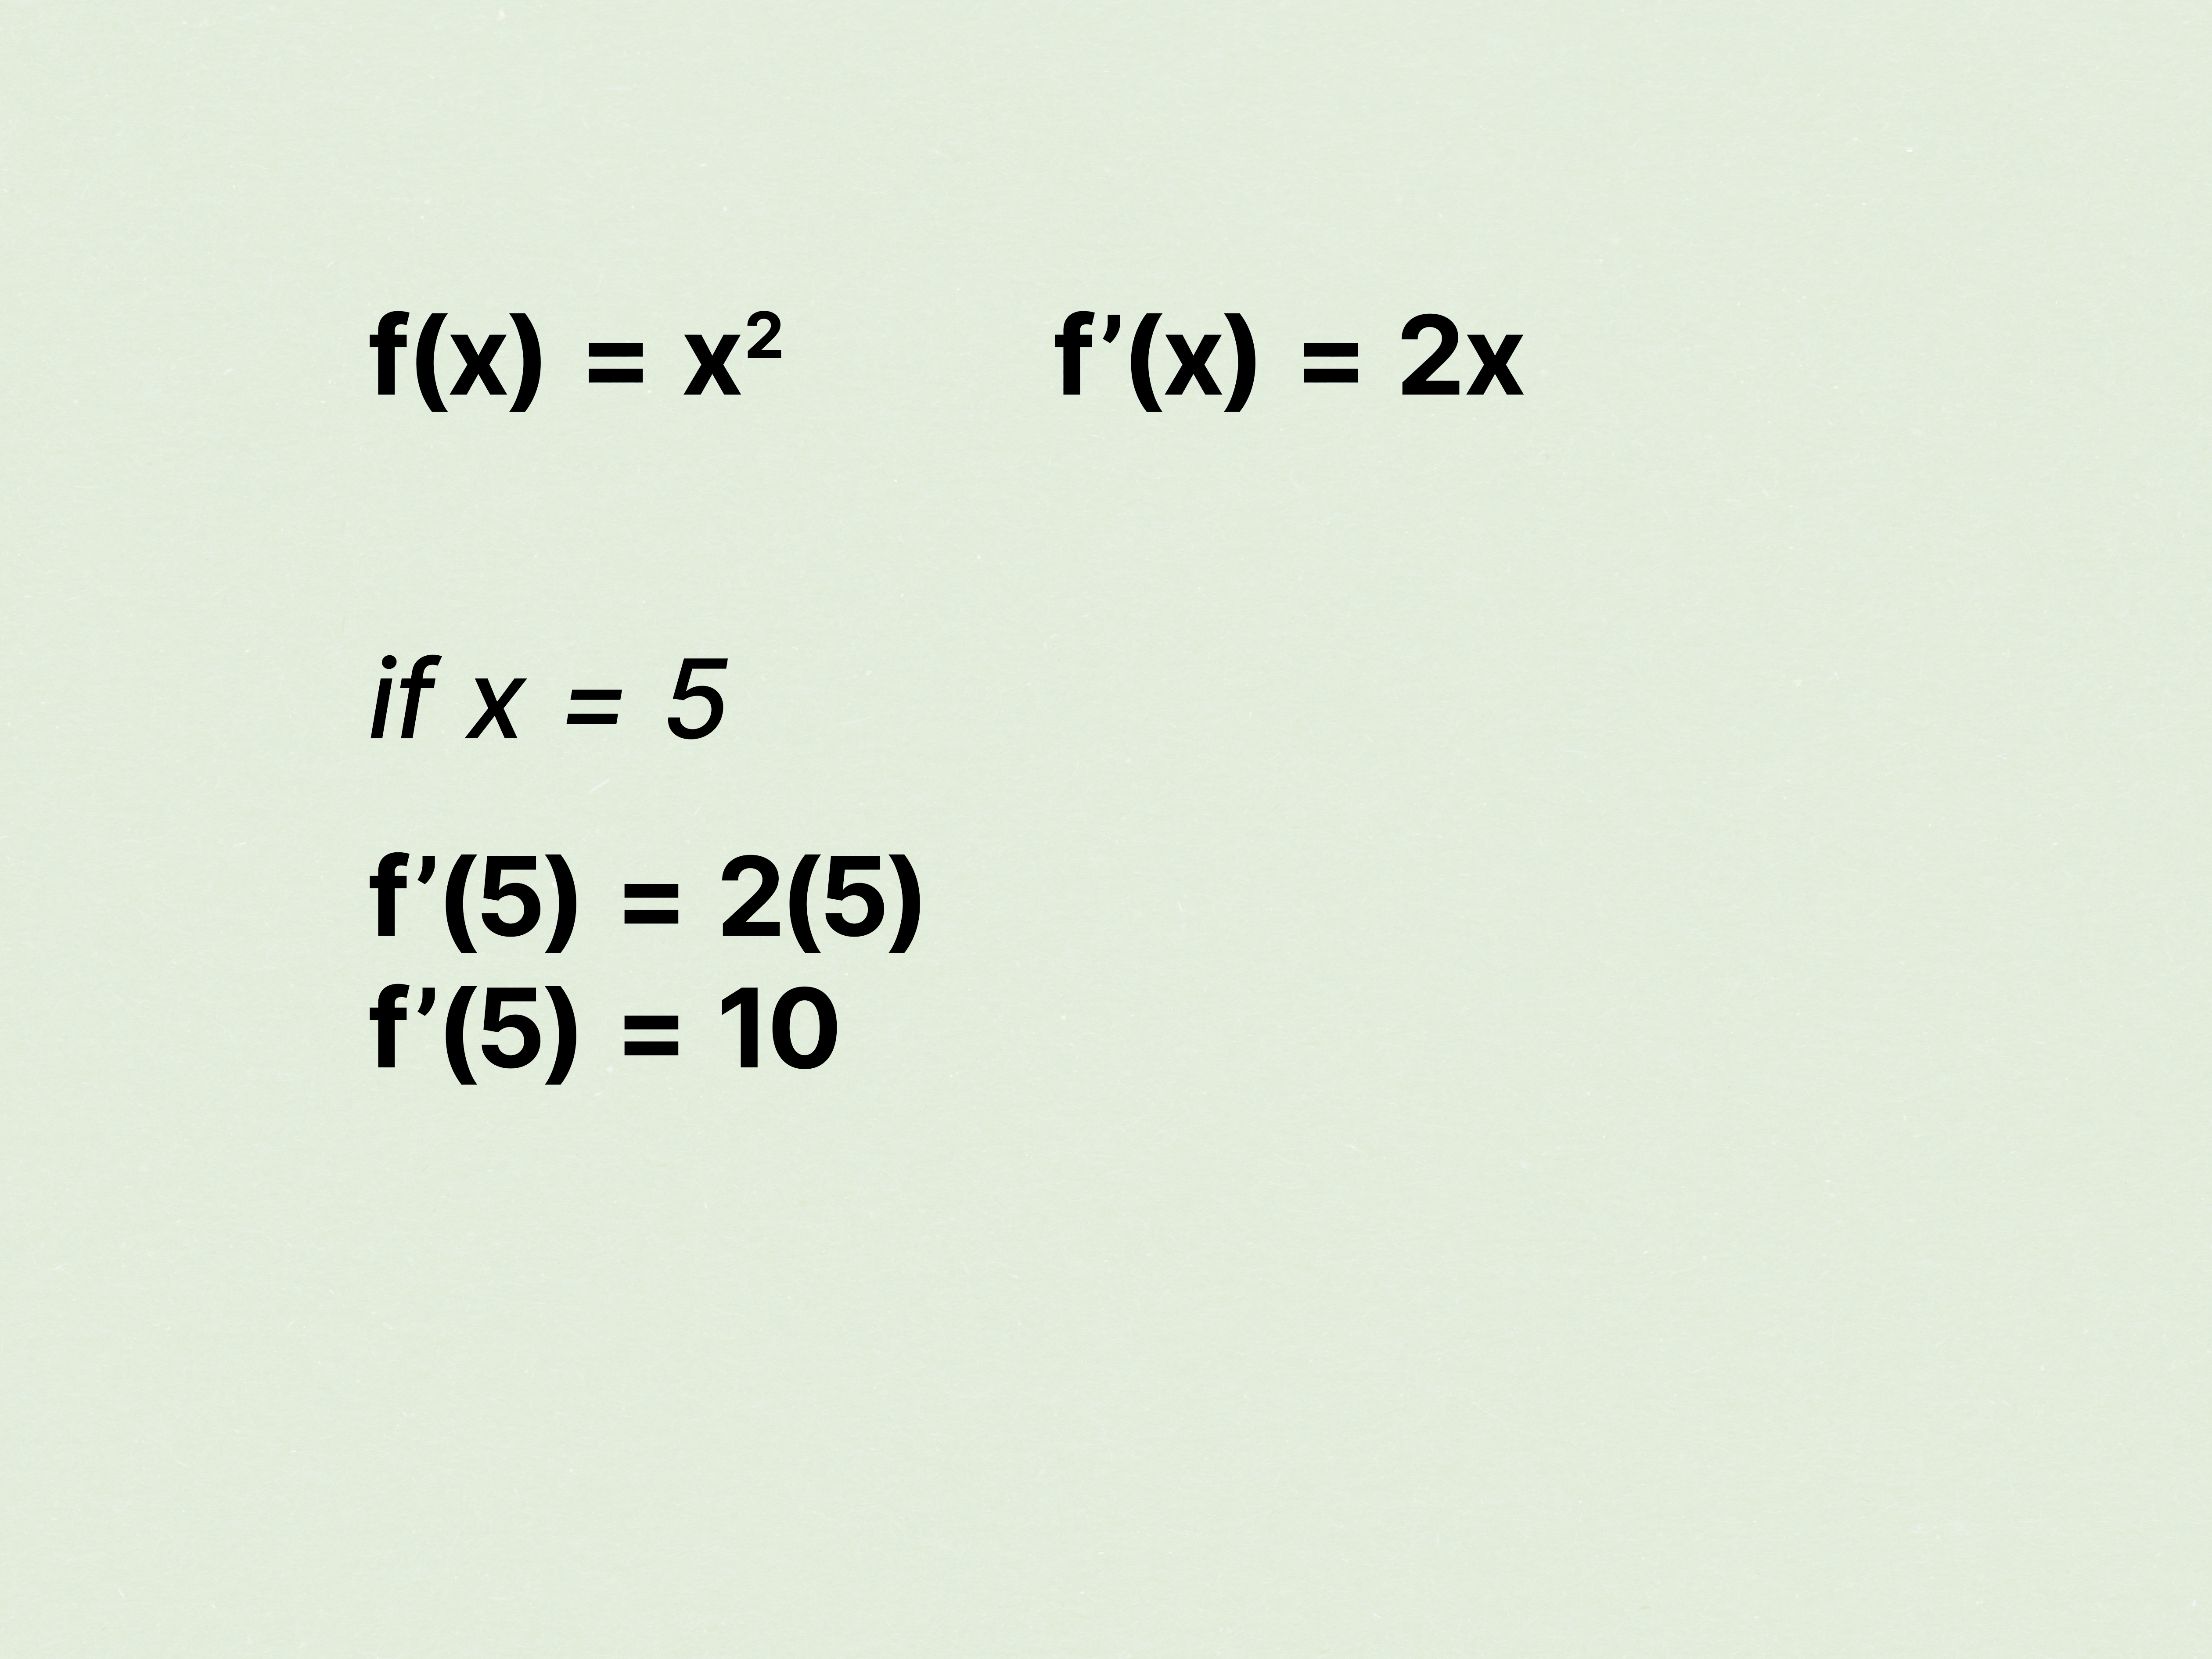
Finding the derivative from a graph sounds like something a math textbook would say right before stealing your afternoon. But the idea is friendlier than it looks: the derivative tells you the slope of a function at a specific point. In plain English, it answers the question, “How fast is this graph changing right here?”
When you look at a graph, you may not have the original equation. Maybe your teacher gives you a curve, a few labeled points, and a look that says, “You’ve got this.” Good news: you actually do. By studying tangent lines, secant lines, increasing and decreasing behavior, turning points, and sharp corners, you can estimate or identify derivatives directly from the picture.
This guide explains how to find the derivative from a graph using practical methods, clear examples, and a little humor because calculus is easier when it stops acting like a mysterious wizard in a robe.
What Does the Derivative Mean on a Graph?
The derivative of a function at a point is the slope of the tangent line at that point. A tangent line is a line that touches the curve at one location and follows the curve’s direction there. If the tangent line rises from left to right, the derivative is positive. If it falls from left to right, the derivative is negative. If it is flat, the derivative is zero.
Think of the graph as a road. The derivative is the steepness of the road at one exact spot. Going uphill? Positive derivative. Going downhill? Negative derivative. Perfectly level? Derivative equals zero. Driving off a cliff-shaped corner? The derivative may not exist, and your math teacher will probably call that “interesting.”
Key idea: slope equals derivative
For a line, slope is easy: rise divided by run. For a curve, the slope changes from point to point, so we use the tangent line to capture the slope at one instant. That slope is written as f′(x), pronounced “f prime of x.”
So when a question asks you to find f′(2) from a graph, it is asking: “What is the slope of the tangent line to the graph when x = 2?”
Method 1: Estimate the Tangent Line Slope
The most common way to find the derivative from a graph is to sketch or imagine the tangent line at the point. Once you have the tangent line, estimate its slope using two convenient points on that line.
Step-by-step method
- Find the point on the graph where you need the derivative.
- Draw a tangent line that just touches the curve and follows its direction.
- Pick two clear points on the tangent line, preferably grid intersections.
- Use the slope formula:
slope = rise / run. - The result is your estimate for the derivative at that point.
Example: estimating a positive derivative
Suppose a curve passes through the point (2, 3), and the tangent line at that point also passes near (4, 7). The slope is:
(7 - 3) / (4 - 2) = 4 / 2 = 2
That means f′(2) ≈ 2. The function is increasing at x = 2, and it is rising about 2 units for every 1 unit it moves to the right.
Example: estimating a negative derivative
Now suppose the tangent line at x = 5 falls as it moves right. If two points on the tangent line are approximately (5, 8) and (7, 2), the slope is:
(2 - 8) / (7 - 5) = -6 / 2 = -3
So f′(5) ≈ -3. The derivative is negative because the graph is decreasing at that point.
Method 2: Use Nearby Points to Estimate the Slope
Sometimes drawing a tangent line is difficult, especially if the graph is curvy, tiny, or printed by a copier that has clearly given up on life. In that case, use nearby points on the graph to estimate the slope.
This method uses a secant line, which is a line through two points on the curve. A secant line gives the average rate of change over an interval. If the two points are close together, that average rate can be a decent estimate of the instantaneous rate of change.
Example: estimating with nearby graph points
Imagine the graph shows these approximate values:
f(1.9) = 3.61f(2.1) = 4.41
To estimate f′(2), calculate the slope between those nearby points:
(4.41 - 3.61) / (2.1 - 1.9) = 0.80 / 0.20 = 4
So the derivative at x = 2 is approximately 4. This method works best when the points are very close to the target x-value and the graph is smooth between them.
Method 3: Read Positive, Negative, and Zero Derivatives
You do not always need an exact number. Many graph questions ask whether the derivative is positive, negative, zero, or undefined. This is where visual thinking saves the day.
Positive derivative
If the graph is rising as you move from left to right, the derivative is positive. The tangent line slopes upward. The steeper the rise, the larger the derivative.
Negative derivative
If the graph is falling as you move from left to right, the derivative is negative. The tangent line slopes downward. A steep drop means a large negative derivative.
Zero derivative
If the graph has a horizontal tangent line, the derivative is zero. This often happens at local maximums and local minimums, though not every flat tangent is a turning point.
For example, at the top of a smooth hill, the graph changes from increasing to decreasing. At the exact peak, the tangent line is flat, so the derivative is 0. At the bottom of a smooth valley, the same thing happens: the tangent line is horizontal, so the derivative is also 0.
Method 4: Identify Where the Derivative Does Not Exist
Not every point on a graph has a derivative. A derivative exists only when the graph is smooth enough at that point to have one clear tangent slope. If the graph behaves badly, the derivative may be undefined. Yes, graphs can have bad behavior. They do not even apologize.
Sharp corners
At a sharp corner, the graph changes direction suddenly. The slope from the left and the slope from the right do not match. Since there is no single tangent slope, the derivative does not exist.
A classic example is the absolute value graph, f(x) = |x|, at x = 0. The left side slopes downward, and the right side slopes upward. At the pointy bottom, there is no single derivative.
Cusps
A cusp is like a sharper, more dramatic corner. The graph may shoot upward or downward on both sides with extreme steepness. At a cusp, the derivative does not exist because the tangent behavior is not well-defined.
Vertical tangents
If the tangent line is vertical, the slope is undefined because the run is zero. Since slope involves dividing by the horizontal change, a vertical tangent does not produce a finite derivative.
Discontinuities
If the graph has a hole, jump, or break at a point, the derivative does not exist there. A function must be continuous at a point before it can be differentiable there. In other words, if the graph is not even connected at the point, asking for a tangent line is like asking a sandwich to explain Wi-Fi.
How to Sketch the Derivative Graph from the Original Graph
Sometimes you are given the graph of f(x) and asked to sketch the graph of f′(x). This sounds fancy, but it is really a slope-tracking mission. You are not copying the original graph. You are graphing its slopes.
Step 1: Mark where the slope is zero
Look for places where the original graph has horizontal tangent lines. These x-values become x-intercepts on the derivative graph because f′(x) = 0 there.
Step 2: Mark where the slope is positive or negative
Where the original function is increasing, the derivative graph is above the x-axis. Where the original function is decreasing, the derivative graph is below the x-axis.
Step 3: Compare steepness
A steep part of the original graph means a large positive or negative value on the derivative graph. A nearly flat section means the derivative value is close to zero.
Step 4: Watch for undefined points
If the original graph has a corner, cusp, vertical tangent, or discontinuity, the derivative graph should show that the derivative does not exist at that x-value. You might draw an open circle, a break, or simply note that the derivative is undefined.
Worked Example: Finding Derivatives from a Graph
Suppose a smooth graph has the following visual behavior:
- It rises steeply until
x = -2. - It has a smooth local maximum at
x = -2. - It decreases between
x = -2andx = 3. - It has a smooth local minimum at
x = 3. - It rises again after
x = 3.
From this, you can conclude:
f′(-2) = 0because the graph has a horizontal tangent at the local maximum.f′(3) = 0because the graph has a horizontal tangent at the local minimum.f′(x) > 0beforex = -2because the graph is increasing.f′(x) < 0betweenx = -2andx = 3because the graph is decreasing.f′(x) > 0afterx = 3because the graph is increasing again.
This is the heart of derivative graph interpretation: follow the slope, not the height. A graph can be high and still have a negative derivative if it is moving downward. It can be low and still have a positive derivative if it is climbing. The derivative cares about direction and steepness, not popularity.
Common Mistakes When Finding Derivatives from Graphs
Mistake 1: Confusing y-values with derivative values
The derivative is not the height of the graph. If the point is high above the x-axis, that does not mean the derivative is positive. Look at whether the graph is rising, falling, or flat at that point.
Mistake 2: Using the curve instead of the tangent line
To estimate a derivative, use the slope of the tangent line, not the general shape of the curve over a long interval. A curve can bend, so a wide interval may give a misleading average slope.
Mistake 3: Forgetting undefined derivatives
Sharp corners, jumps, holes, cusps, and vertical tangents are warning signs. Do not force a derivative to exist just because the problem looks lonely without one.
Mistake 4: Ignoring scale
Always check the graph’s axes. If each square on the x-axis represents 2 units and each square on the y-axis represents 10 units, your slope estimate changes. The graph is not decoration; it is giving you measurements.
Tips for Estimating Derivatives More Accurately
First, choose points on the tangent line that are far enough apart to reduce reading error but still clearly on the line you drew. Second, use grid intersections whenever possible. Third, zoom in mentally: the derivative is local, so focus near the point rather than the entire curve. Finally, write “approximately” when reading from a graph. Unless the graph is perfectly labeled, most derivative values from graphs are estimates.
It also helps to compare several nearby slopes. If the tangent looks close to a slope of 2, but your calculation gives 8, check your points, your axis scale, and your caffeine level.
Real-Life Meaning of Finding a Derivative from a Graph
Derivatives from graphs are not just school exercises. They appear anywhere change matters. On a distance-time graph, the derivative represents velocity. On a velocity-time graph, the derivative represents acceleration. On a cost graph, the derivative can represent marginal cost. On a population graph, it can show growth rate. On a temperature graph, it can show how quickly the temperature is rising or falling.
For example, if a distance-time graph is steep, the object is moving quickly. If it is flat, the object is stopped. If the graph slopes downward, the object may be moving back toward its starting point. The derivative turns visual movement into numerical meaning.
Experience-Based Advice: Learning to See Derivatives on a Graph
One of the biggest breakthroughs students have with derivatives is realizing that a graph is not just a pictureit is a story about change. When I first learned to find derivatives from graphs, I made the classic mistake of staring at the y-values as if they were hiding the answer in tiny mathematical sunglasses. If the graph was above the x-axis, I assumed the derivative must be positive. If it was below the x-axis, I assumed negative. That is wrong, but it is a very normal wrong.
The better habit is to ask, “What is the graph doing as I move left to right?” This single question clears up most confusion. If the graph is climbing, the derivative is positive. If it is falling, the derivative is negative. If it pauses at a smooth top or bottom, the derivative is zero. If it has a sudden corner or break, the derivative may not exist. Once you train your eyes to look for motion instead of height, derivative problems become much less intimidating.
Another helpful experience is practicing with a ruler or straightedge. Place it on the graph at the point of interest and rotate it until it just matches the direction of the curve. That line is your tangent estimate. Then find two easy points on the ruler line and calculate rise over run. This simple physical method can make the abstract idea of a tangent line feel surprisingly concrete. It is like giving calculus a handle.
When sketching derivative graphs, I recommend making a quick sign chart before drawing anything fancy. Mark the x-values where the original graph has flat tangents, corners, or discontinuities. Then label each interval as increasing or decreasing. Above the x-axis means positive derivative; below means negative derivative. This prevents the common “spaghetti derivative graph” problem, where the sketch wiggles around with confidence but no actual plan.
It is also useful to describe the graph out loud. Say: “The function is increasing slowly, then increasing quickly, then flattening out.” That translates to: “The derivative is positive, then getting larger, then moving toward zero.” This kind of verbal translation builds strong intuition. You are basically narrating the slope’s mood swings.
Finally, remember that estimates are allowed when working from a graph. Unless the tangent line and coordinates are clearly given, your answer may not be exact. A reasonable estimate with correct reasoning is often better than a suspiciously perfect number pulled from the mathematical fog. The goal is not to guess magically. The goal is to read the graph carefully, understand slope, and explain your thinking clearly.
Conclusion
Learning how to find the derivative from a graph is really learning how to read slope visually. The derivative tells you how fast a function changes at a point, and the graph gives you clues through tangent lines, steepness, increasing and decreasing intervals, horizontal tangents, and places where smoothness breaks down.
Use tangent lines for point estimates, secant lines for nearby approximations, and sign analysis to decide whether the derivative is positive, negative, zero, or undefined. When sketching a derivative graph, remember that you are graphing the slopes of the original function, not copying its shape. That one idea can rescue you from a surprising number of calculus traps.
In short: follow the slope. The derivative is already on the graphyou just need to know where to look.
SEO Tags
Note: This article is written as original, publication-ready educational content based on standard calculus principles from reputable learning resources.