Graphing a quadratic equation can feel a little like trying to draw a smiley face while your calculator is silently judging you. But once you know what to look for, a quadratic graph is surprisingly friendly. It is not random, mysterious, or powered by algebraic witchcraft. It is a parabola, a smooth U-shaped curve that follows predictable rules.
In this guide, you will learn how to graph a quadratic equation in 10 clear steps. We will use the equation y = ax² + bx + c, explain how to find the vertex, axis of symmetry, intercepts, and matching points, then walk through a full example. By the end, you will be able to sketch a quadratic graph by hand without treating graph paper like a crime scene.
What Is a Quadratic Equation?
A quadratic equation is an equation where the highest power of the variable is 2. The most common form is:
y = ax² + bx + c
In this form, a, b, and c are numbers, and a cannot be 0. If a were 0, the x² term would disappear, and the equation would become linear. In other words, it would stop being a dramatic curved parabola and become a plain old straight line.
The graph of a quadratic equation is called a parabola. Depending on the value of a, the parabola can open upward like a smile or downward like a frown. The graph may cross the x-axis twice, once, or not at all. It always has a turning point called the vertex.
Key Vocabulary Before You Start
Parabola
A parabola is the curved shape made by a quadratic equation. It is symmetrical, which means one side mirrors the other.
Vertex
The vertex is the highest or lowest point of the parabola. If the graph opens upward, the vertex is the minimum point. If it opens downward, the vertex is the maximum point.
Axis of Symmetry
The axis of symmetry is the vertical line that cuts the parabola into two matching halves. It always passes through the vertex.
X-Intercepts
The x-intercepts are the points where the graph crosses the x-axis. These are also called roots, zeros, or solutions.
Y-Intercept
The y-intercept is the point where the graph crosses the y-axis. For y = ax² + bx + c, the y-intercept is usually easy to find because it happens when x = 0.
How to Graph a Quadratic Equation: 10 Steps
Step 1: Identify the Form of the Equation
Start by looking at the equation. Most quadratic equations used for graphing appear in standard form:
y = ax² + bx + c
For example:
y = x² – 4x + 3
Here, a = 1, b = -4, and c = 3. Identifying these numbers is the first step because they help you determine the direction, shape, vertex, and intercepts of the graph.
Step 2: Determine Whether the Parabola Opens Up or Down
Look at the coefficient a, the number in front of x².
If a > 0, the parabola opens upward. If a < 0, the parabola opens downward.
For y = x² – 4x + 3, the value of a is 1. Since 1 is positive, the parabola opens upward. Think of it as a smile. Algebra is being polite today.
The size of a also affects the width of the graph. If the absolute value of a is greater than 1, the parabola becomes narrower. If the absolute value of a is between 0 and 1, the parabola becomes wider.
Step 3: Find the Axis of Symmetry
The axis of symmetry is one of the most useful features of a quadratic graph. For a quadratic equation in standard form, use this formula:
x = -b / 2a
For the equation y = x² – 4x + 3, we have:
a = 1 and b = -4
So:
x = -(-4) / 2(1) = 4 / 2 = 2
The axis of symmetry is:
x = 2
This means the left and right sides of the parabola match each other across the vertical line x = 2.
Step 4: Find the Vertex
The vertex lies on the axis of symmetry. Since the axis of symmetry is x = 2, plug x = 2 into the original equation to find the y-value.
y = x² – 4x + 3
y = (2)² – 4(2) + 3
y = 4 – 8 + 3
y = -1
So the vertex is:
(2, -1)
Because the parabola opens upward, this vertex is the lowest point on the graph.
Step 5: Find the Y-Intercept
The y-intercept occurs where x = 0. Substitute 0 into the equation:
y = 0² – 4(0) + 3
y = 3
The y-intercept is:
(0, 3)
This is where the graph crosses the y-axis. In standard form, the y-intercept is often easy to spot because it is the value of c. In this example, c = 3, so the y-intercept is (0, 3).
Step 6: Find the X-Intercepts
The x-intercepts happen where y = 0. Set the equation equal to zero:
0 = x² – 4x + 3
Now factor:
0 = (x – 1)(x – 3)
Set each factor equal to zero:
x – 1 = 0 gives x = 1
x – 3 = 0 gives x = 3
The x-intercepts are:
(1, 0) and (3, 0)
If a quadratic cannot be factored easily, you can use the quadratic formula or complete the square. Sometimes the graph does not cross the x-axis at all, which means there are no real x-intercepts.
Step 7: Choose Additional Points
Although the vertex and intercepts give you a strong start, extra points help make your parabola more accurate. Choose x-values on both sides of the vertex.
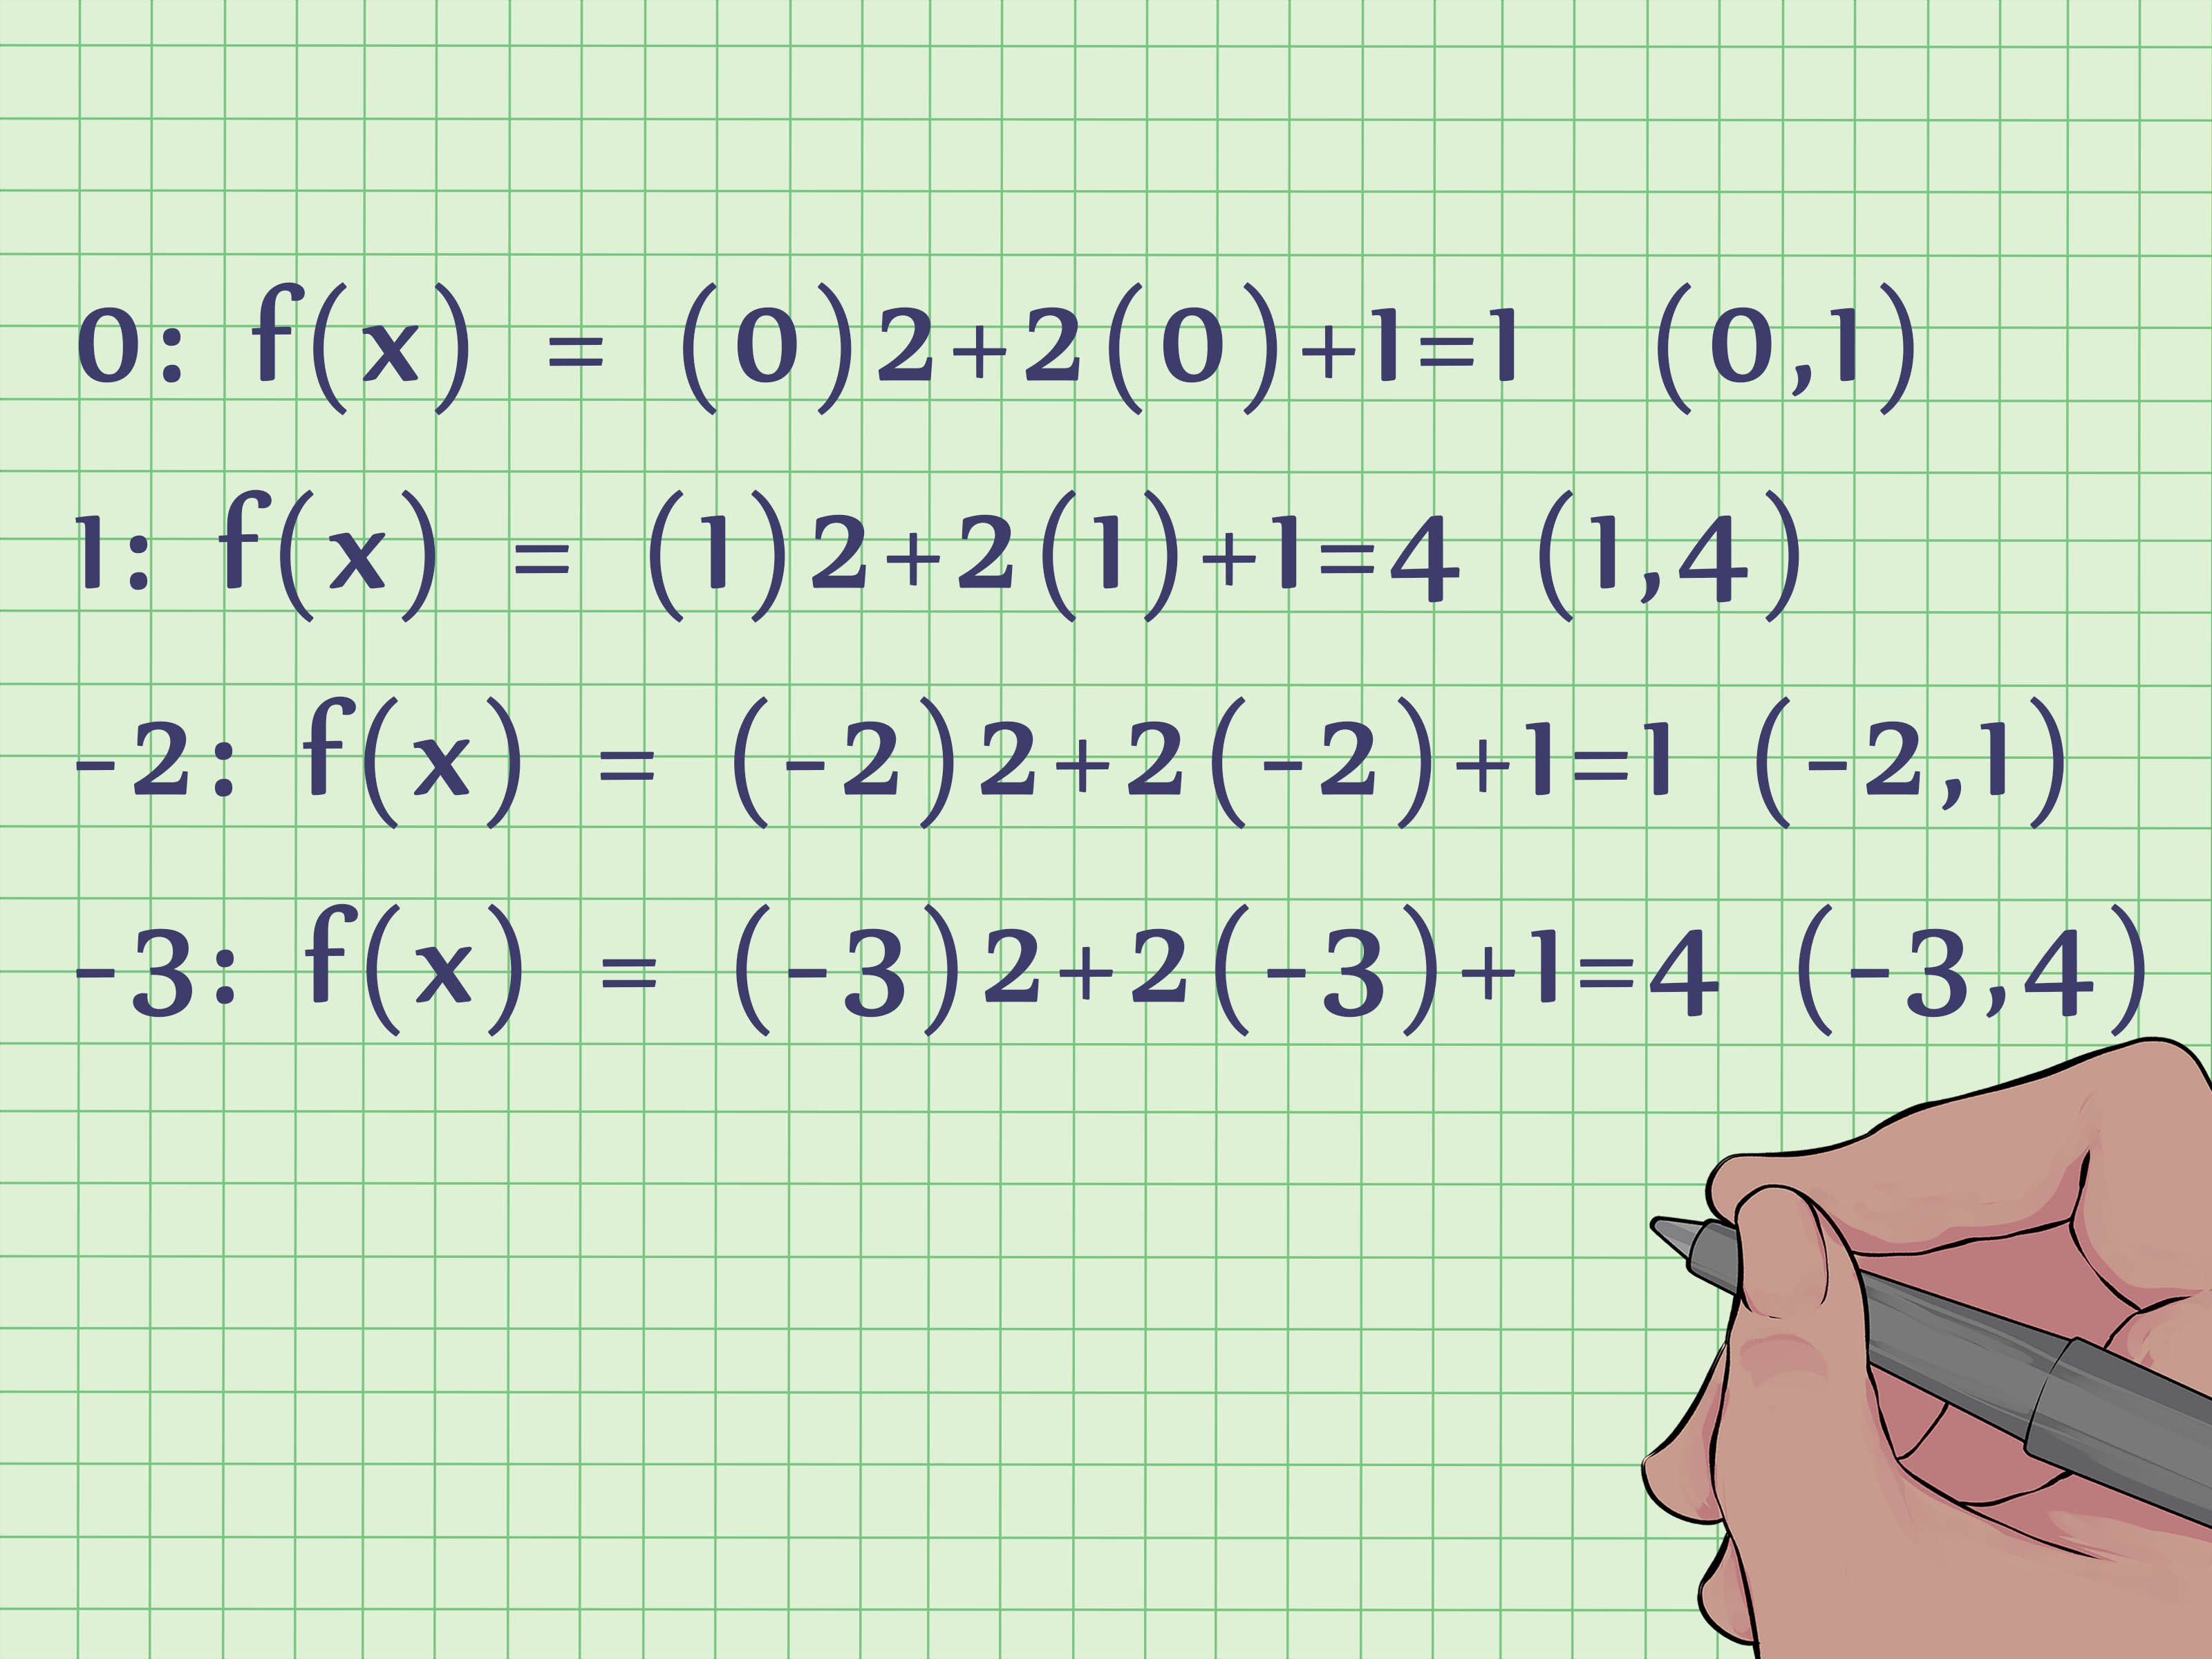
For our example, the vertex is at x = 2. Pick values such as x = -1, x = 0, x = 1, x = 2, x = 3, x = 4, and x = 5.
Create a small table:
| x | y = x² – 4x + 3 | Point |
|---|---|---|
| -1 | 8 | (-1, 8) |
| 0 | 3 | (0, 3) |
| 1 | 0 | (1, 0) |
| 2 | -1 | (2, -1) |
| 3 | 0 | (3, 0) |
| 4 | 3 | (4, 3) |
| 5 | 8 | (5, 8) |
Notice the matching y-values around x = 2. That symmetry is not a coincidence. It is the parabola doing its job like a well-trained algebra puppy.
Step 8: Plot the Points on the Coordinate Plane
Now plot the key points on your graph:
(2, -1) for the vertex
(0, 3) for the y-intercept
(1, 0) and (3, 0) for the x-intercepts
(-1, 8), (4, 3), and (5, 8) as extra points
Use graph paper if you are working by hand. Keep the spacing even on both axes. If one square equals one unit on the x-axis, it should also represent one unit on the y-axis unless your teacher or assignment says otherwise.
Step 9: Draw a Smooth Curve
Connect the points with a smooth U-shaped curve. Do not connect them with straight line segments. A parabola is curved, not a mountain range.
Start near the upper left, curve down through the points, pass through the vertex, then curve upward through the matching points on the right. The graph should be symmetrical around the axis of symmetry x = 2.
If one side looks much wider or steeper than the other, check your plotted points. A quadratic graph should look balanced unless the coordinate scale is unusual.
Step 10: Check Your Graph
Before calling the graph finished, check these details:
- Does the parabola open in the correct direction?
- Is the vertex plotted correctly?
- Does the axis of symmetry pass through the vertex?
- Are the x-intercepts and y-intercept correct?
- Are matching points the same distance from the axis of symmetry?
- Is the curve smooth instead of pointy or jagged?
For y = x² – 4x + 3, the finished graph should open upward, have a vertex at (2, -1), cross the x-axis at (1, 0) and (3, 0), and cross the y-axis at (0, 3).
Graphing a Quadratic Equation in Vertex Form
Sometimes a quadratic equation is written in vertex form:
y = a(x – h)² + k
This form is extremely helpful because the vertex is already visible. The vertex is (h, k). For example:
y = 2(x – 3)² + 4
The vertex is (3, 4). The value of a = 2, so the parabola opens upward and is narrower than the basic graph y = x².
To graph from vertex form, start with the vertex, use the value of a to determine the direction and width, then choose points on both sides of the vertex.
Graphing a Quadratic Equation in Factored Form
A quadratic may also appear in factored form:
y = a(x – r₁)(x – r₂)
This form makes the x-intercepts easy to find. The graph crosses the x-axis at r₁ and r₂. For example:
y = (x – 2)(x + 4)
The x-intercepts are (2, 0) and (-4, 0). The axis of symmetry is halfway between the x-intercepts:
x = (-4 + 2) / 2 = -1
Then plug x = -1 into the equation to find the vertex.
Common Mistakes When Graphing Quadratics
Mistake 1: Forgetting the Negative Sign in the Axis Formula
The formula is x = -b / 2a, not x = b / 2a. That tiny negative sign has ruined many otherwise peaceful afternoons.
Mistake 2: Drawing a Pointy Graph
A parabola should be smooth. The vertex is a turning point, not a sharp corner.
Mistake 3: Confusing the Vertex with the Y-Intercept
The y-intercept is where the graph crosses the y-axis. The vertex is the maximum or minimum point. Sometimes they are the same point, but usually they are not.
Mistake 4: Plotting Only Two Points
Two points are enough for a line, but not enough for a parabola. Use at least five points when possible: the vertex, two points on one side, and their mirror points on the other side.
Mistake 5: Ignoring Symmetry
Symmetry is your built-in error checker. If points on opposite sides of the axis do not match, something may be wrong with your calculations or plotting.
Why Learning to Graph Quadratics Matters
Quadratic graphs are not just classroom decorations. They model many real-world situations, including projectile motion, area problems, business profit, architecture, engineering, and physics. When a ball is thrown into the air, its path often forms a parabola. When a company studies profit based on price, a quadratic model may help estimate maximum revenue. When a designer works with arches or reflectors, parabolic shapes can appear again.
Understanding how to graph a quadratic equation helps you see more than just numbers. You can identify maximum and minimum values, estimate solutions, understand change, and interpret mathematical relationships visually. In plain English, graphing helps algebra stop hiding behind symbols.
A Complete Example: Graph y = -x² + 6x – 5
Let’s graph another quadratic equation:
y = -x² + 6x – 5
First, identify the coefficients:
a = -1, b = 6, c = -5
Because a is negative, the parabola opens downward.
Find the axis of symmetry:
x = -b / 2a = -6 / 2(-1) = 3
Now find the vertex by plugging in x = 3:
y = -(3)² + 6(3) – 5
y = -9 + 18 – 5 = 4
The vertex is:
(3, 4)
Find the y-intercept by setting x = 0:
y = -5
The y-intercept is:
(0, -5)
Find the x-intercepts by setting y = 0:
0 = -x² + 6x – 5
Multiply by -1 to make factoring easier:
0 = x² – 6x + 5
Factor:
0 = (x – 1)(x – 5)
So the x-intercepts are:
(1, 0) and (5, 0)
Now plot the vertex, intercepts, and a few extra points. Since the axis of symmetry is x = 3, the graph should balance on both sides of that line. Draw a smooth downward-opening curve through the points.
Extra Experience: What Graphing Quadratics Teaches You Over Time
The more you practice graphing quadratic equations, the more you start to recognize patterns before you even pick up a pencil. At first, most students focus on memorizing formulas. That is normal. The axis of symmetry formula, the vertex calculation, and the intercept process can feel like a lot to juggle. But after several examples, the graph begins to make sense as a picture of the equation instead of a separate assignment.
One helpful experience is learning to predict the graph before plotting every point. For instance, when you see y = 3x² + 2x – 1, you can immediately expect the parabola to open upward and look narrower than y = x². When you see y = -0.5x² + 4, you can expect a downward-opening parabola that is wider than the parent graph. These quick observations make graphing faster and help catch errors early.
Another important lesson is that the vertex tells a story. In many real-world problems, the vertex represents the best or worst value. If a quadratic models the height of a thrown object, the vertex may show the maximum height. If it models profit, the vertex may show the maximum profit. If it models cost, the vertex may show the minimum cost. That tiny turning point is often the star of the show, even if the x-intercepts get more attention.
Students also discover that graphing by hand and using a graphing calculator are not enemies. They are teammates. A graphing calculator or online graphing tool can help confirm your work, but hand graphing builds understanding. If you only type an equation into a tool, you may get the picture without knowing why it looks that way. If you graph it by hand first, the calculator becomes a way to check your thinking instead of replacing it.
A practical tip from experience: always organize your work. Write down a, b, and c. Label the axis of symmetry. Box or circle the vertex. Make a table of values. Plot points carefully. Many graphing mistakes do not come from misunderstanding quadratics; they come from rushing. Algebra rewards patience, which is rude but true.
It also helps to say what each part means out loud. For example: “The parabola opens down because a is negative. The axis of symmetry is x = 3. The vertex is (3, 4), so that is the highest point.” This simple habit turns a pile of calculations into a logical explanation. Teachers love that. Test graders love that. Your future self, staring at homework at 11:47 p.m., will also love that.
Finally, graphing quadratics teaches visual confidence. You begin to see that equations are not just symbols sitting on a page. They create shapes, patterns, and relationships. A quadratic equation tells you where a curve starts, where it turns, where it crosses the axes, and how it behaves. Once you understand that, the graph stops being a mystery and starts becoming a map.
Conclusion
Learning how to graph a quadratic equation is much easier when you follow a reliable process. Start by identifying the equation form, determine whether the parabola opens up or down, find the axis of symmetry, calculate the vertex, locate the intercepts, choose extra points, and draw a smooth curve. With practice, these steps become natural.
The most important idea is that every quadratic graph has structure. The vertex, axis of symmetry, intercepts, and direction all work together. Once you understand those features, graphing quadratics becomes less about memorizing rules and more about reading the equation like a map. And unlike some maps, this one does not tell you to make a U-turn in the middle of a lake.
Note: This article synthesizes established approaches commonly used in U.S. algebra instruction, including standard textbook methods, graphing calculator practices, and classroom explanations of parabolas, vertices, symmetry, and intercepts.